Some snapshots of ITM Performance Analyzer on Windows 2012 connecting to DB2.
Other related information is also captured.
http://publib.boulder.ibm.com/infocenter/tivihelp/v61r1/index.jsp?topic=%2Fcom.ibm.itm.doc_6.3%2Fwelcome.htm
This is the TEP GUI Client rendering the PA related information, and the Performance Analyzer tasks.
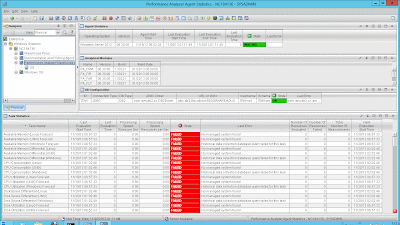
Snapshot of the
"Manage Tivoli Monitoring " icon on Windows 2012 :
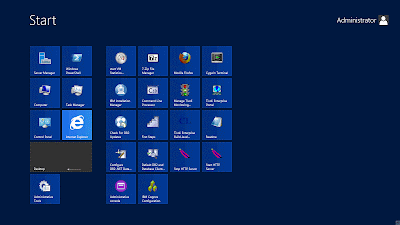
The Search Option in Windows 2012 is hover to the right of the screen a Popup with the Search on the right appears
Here, one can find the Search or the Find icons.
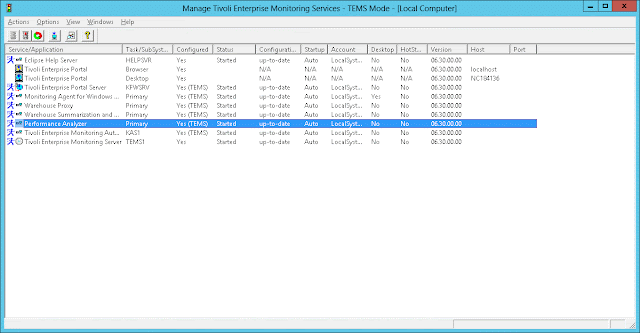
Snap of the MTEMS - showing ability to configure the PA and other ITM components.
Configiration of the PA - to the Database - here we are connecting to the DB2.
Notice the Database jar files ( db2jcc nd db2jcc_license.jar )
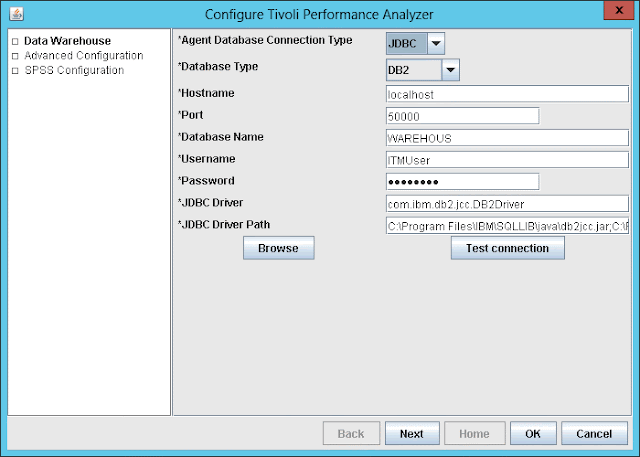
The default password for the itmuser is "itmpswd1".
The ODBC connection is launched from the following folder:
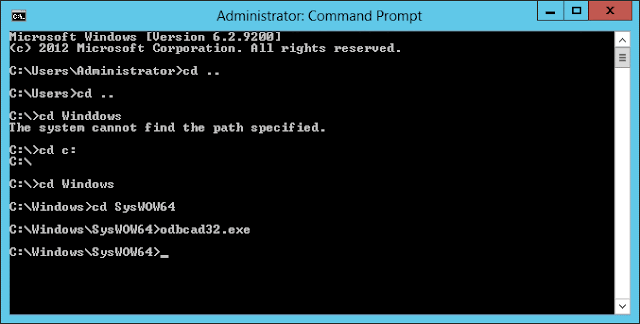
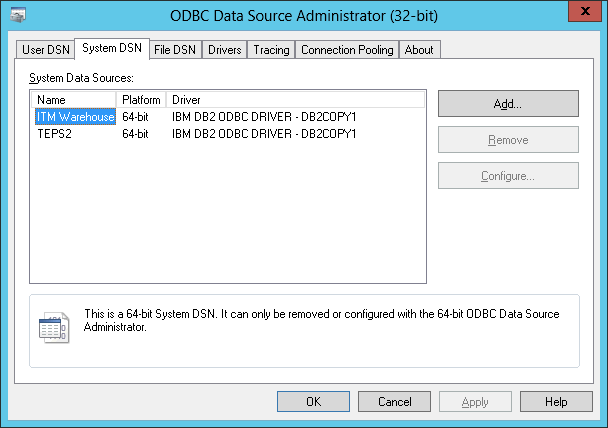
this launches this application.
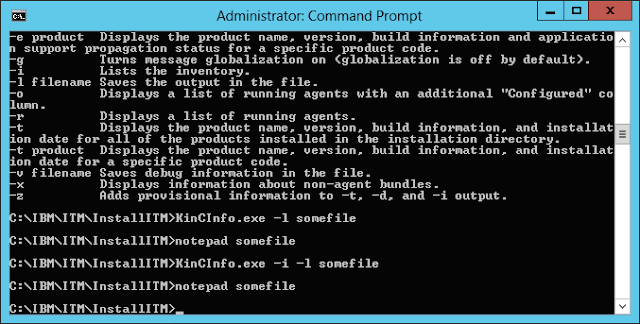
The cinfo equivalent is KinCInfo.exe is in c:/IBM/ITM/InstallITM
Run the script with the -i option to get the list of all installed products.
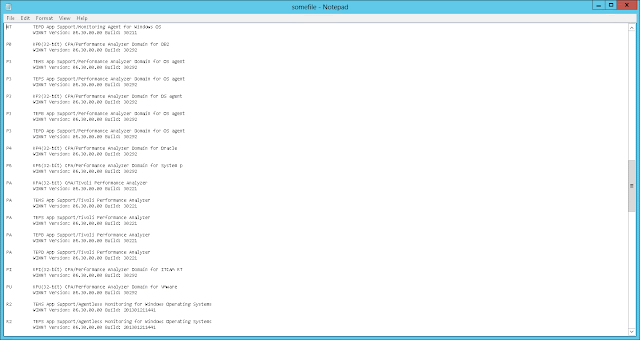
The installers for 6.3.2 can be found at
http://publib.boulder.ibm.com/infocenter/tivihelp/v61r1/index.jsp?topic=%2Fcom.ibm.itm.doc_6.3%2Fwelcome.htm
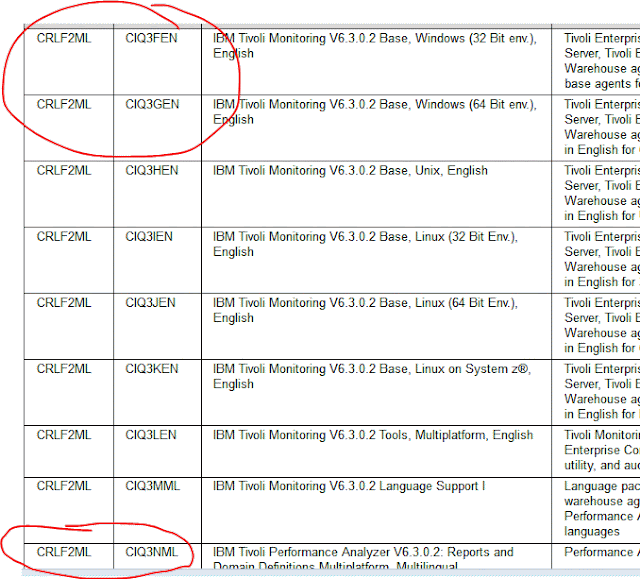
Run the "setup.exe",and not the "install.exe" to launch the Installer.
Snapshot of some of the Windows OS attributes being configured.
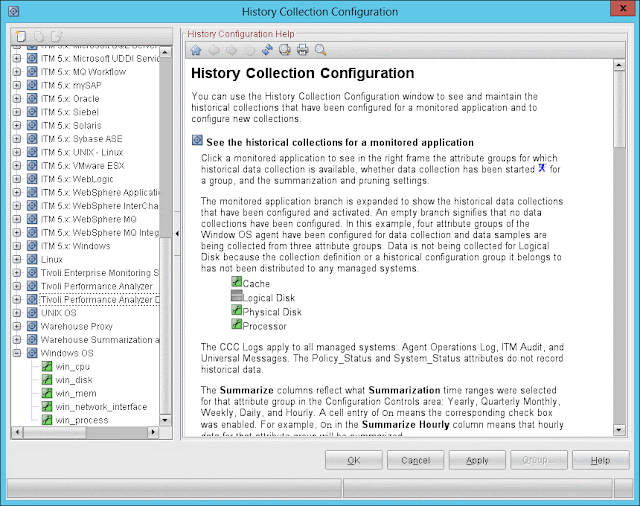
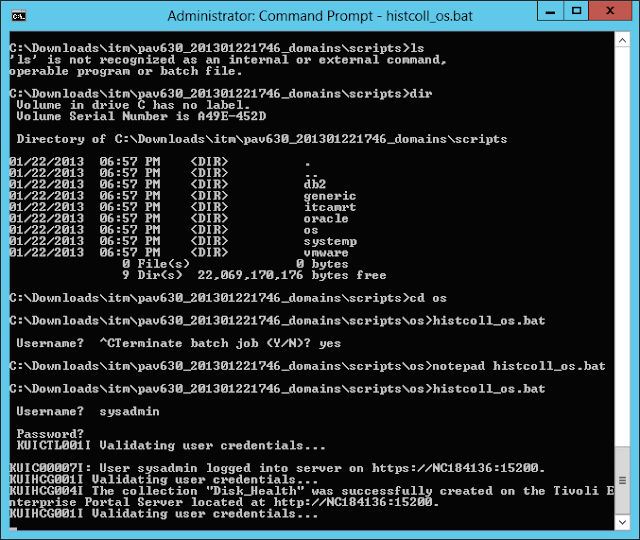
The PA attributes has to be configured on the windows server using the histcoll_os.bat script found in the installer/scripts/os folder.
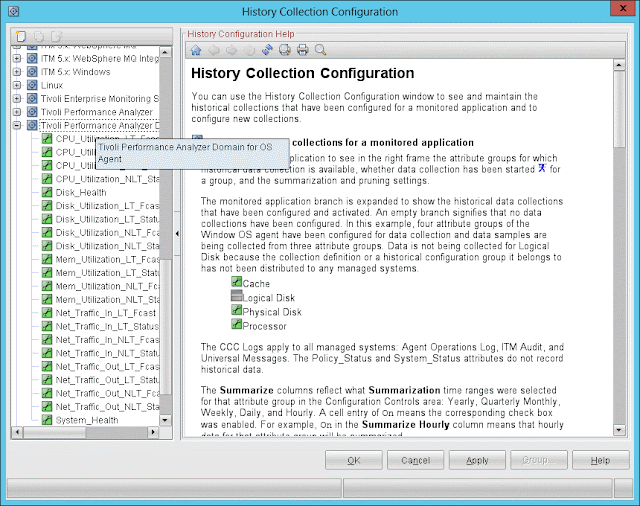
Run the script histcoll_os.bat by providing the user id and password ( sysadmin / password ) after which you will see the entries in the Tivoli Performance Analyzer Domain for OS Agent.
Note the entries below for the Tivoli Perf Analyzer Domains for OS - these get created after the above script is run.
Below I will show how to distinguish the different types of PA analytical tasks. ( they can be Linear Trending, or Arithmetic Expression , or Non - Linear Trending if SPSS is installed )
Click on the PA config icon on the TEP panel. ( it is the one with up diagonal zigzag arrow mark ) going up.
This opens the PA Tasks panel.
Click on any task and the right side panel shows the task - whether it is 'Arithmetic' or 'Linear trending'
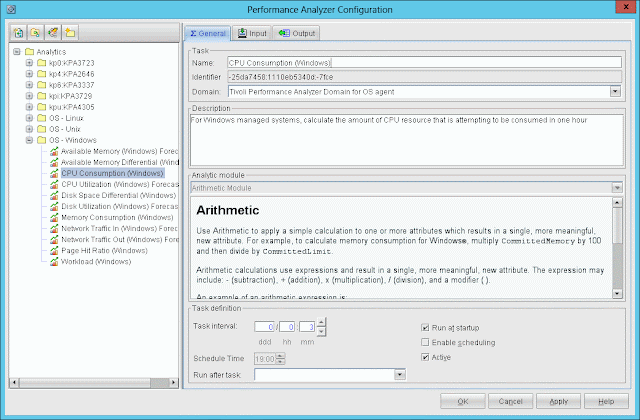
See below examples. "CPU Consumption" is Arithmetic - click on the Input tab to see the arithmetic expression used to calculate the trending.
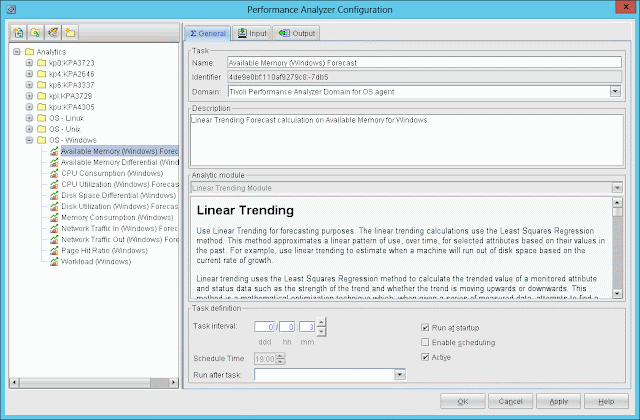
Below is Linear Trending example.
The logs for the PA can be found in the C;\IBM\ITM\TMAITM6\logs kpacma..log folder.
( dir /o /s kpacma.log - can be used to search in case the install folder is different )
The supported platforms - can be found in the ITM Install guide.
http://publib.boulder.ibm.com/infocenter/tivihelp/v61r1/index.jsp?topic=%2Fcom.ibm.itm.doc_6.3%2Finstall%2Fitm_install.htm
( on a related note: PA on Windows 2003 is not supported )
Steps to identify the PA version on the Windows .
Other related information is also captured.
http://publib.boulder.ibm.com/infocenter/tivihelp/v61r1/index.jsp?topic=%2Fcom.ibm.itm.doc_6.3%2Fwelcome.htm
This is the TEP GUI Client rendering the PA related information, and the Performance Analyzer tasks.

Snapshot of the
"Manage Tivoli Monitoring " icon on Windows 2012 :

The Search Option in Windows 2012 is hover to the right of the screen a Popup with the Search on the right appears
Here, one can find the Search or the Find icons.
Snap of the MTEMS - showing ability to configure the PA and other ITM components.

Configiration of the PA - to the Database - here we are connecting to the DB2.
Notice the Database jar files ( db2jcc nd db2jcc_license.jar )

The default password for the itmuser is "itmpswd1".
The ODBC connection is launched from the following folder:

this launches this application.

The cinfo equivalent is KinCInfo.exe is in c:/IBM/ITM/InstallITM
Run the script with the -i option to get the list of all installed products.


The installers for 6.3.2 can be found at
http://publib.boulder.ibm.com/infocenter/tivihelp/v61r1/index.jsp?topic=%2Fcom.ibm.itm.doc_6.3%2Fwelcome.htm

Run the "setup.exe",and not the "install.exe" to launch the Installer.
Snapshot of some of the Windows OS attributes being configured.

The PA attributes has to be configured on the windows server using the histcoll_os.bat script found in the installer/scripts/os folder.
Run the script histcoll_os.bat by providing the user id and password ( sysadmin / password ) after which you will see the entries in the Tivoli Performance Analyzer Domain for OS Agent.

Note the entries below for the Tivoli Perf Analyzer Domains for OS - these get created after the above script is run.

Below I will show how to distinguish the different types of PA analytical tasks. ( they can be Linear Trending, or Arithmetic Expression , or Non - Linear Trending if SPSS is installed )
Click on the PA config icon on the TEP panel. ( it is the one with up diagonal zigzag arrow mark ) going up.
This opens the PA Tasks panel.
Click on any task and the right side panel shows the task - whether it is 'Arithmetic' or 'Linear trending'
See below examples. "CPU Consumption" is Arithmetic - click on the Input tab to see the arithmetic expression used to calculate the trending.

Below is Linear Trending example.

The logs for the PA can be found in the C;\IBM\ITM\TMAITM6\logs kpacma..log folder.
( dir /o /s kpacma.log - can be used to search in case the install folder is different )
The supported platforms - can be found in the ITM Install guide.
http://publib.boulder.ibm.com/infocenter/tivihelp/v61r1/index.jsp?topic=%2Fcom.ibm.itm.doc_6.3%2Finstall%2Fitm_install.htm
( on a related note: PA on Windows 2003 is not supported )
Steps to identify the PA version on the Windows .
No comments:
Post a Comment