Thursday, June 12, 2014

List and viewing Agents configured under a Managed System List

Managed System Lists is a way of organizing agents in ITM to be monitored.

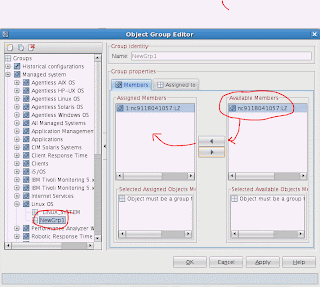
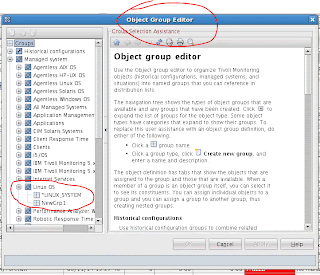
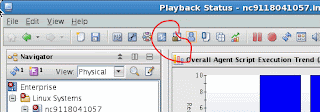
The MSL can be configured in TEPS GUI by clicking the "Object Group Editor" icon


To assign servers to the MSL -


And to view them in the back end - on a Linux server - use these commands


1. First you would login as follows.
 tacmd login -s localhost

2.
To view all the MSL  :

tacmd listsystemlist

< list of all MSL will show up as outputs >

3.
To view all the agents configured under a MSL

tacmd viewsystemlist -l MSLName

Name                    : MSL Name
Type                    : Linux OS
Assigned Managed Systems: nc9118041057:LZ  <=========== is the name of the agent configured under the


Thursday, May 29, 2014

Limitations ( internal )

How to monitor the memory limitation of the Performance Analyzer agent on an AIX server.

Some of the commands.

prtconf
will tell the memory size of the server.


System Model: IBM,9117-MMA
Machine Serial Number: 105BD0D
Processor Type: PowerPC_POWER6
Processor Implementation Mode: POWER 6
Processor Version: PV_6_Compat
Number Of Processors: 4
Processor Clock Speed: 4208 MHz
CPU Type: 64-bit
Kernel Type: 64-bit
LPAR Info: 7 va10tuvtdw001
Memory Size: 8192 MB
Good Memory Size: 8192 MB
Platform Firmware level: EM350_063
Firmware Version: IBM,EM350_063
Console Login: enable
Auto Restart: true
Full Core: false


PA can handle upto 10,000 agents on a 32 or a 64 bit platform.
(62+803+392+1814+7265) + 201 [vmware] = 10537 = PA meets the threshold.  (note: this is far more than the 2k, and just above the 10K test agents)

On the other hand:
(62+803+392+1814+7265) + 0[vmware] = 10336 =  PA can handle but almost there.


tacmd listsystems

to get the list of all configured agents.

tacmd login -s `hostname` -u sysadmin                                  
                                                                       
tacmd listSystems ( I believe you have to run with a flag  -v option )


bootinfo -k    

# bootinfo -k
3            


LDR_CNTRL=MAXDATA=0x80000000  This allows upto 2GB of heap space.      
KPA_JAVA_ARGS=-Xms16m -Xmx500m                                          


$ grep -i ldr_cntrl /opt/IBM/ITM/config/pa.ini
LDR_CNTRL=MAXDATA=0x80000000
$ grep -i kpa_java  /opt/IBM/ITM/config/pa.ini
KPA_JAVA_ARGS=-Xmx512m                                                      


ulimit -a  

# ulimit -a
time(seconds)        unlimited
file(blocks)         unlimited
data(kbytes)         131072
stack(kbytes)        unlimited
memory(kbytes)       unlimited
coredump(blocks)     unlimited
nofiles(descriptors) unlimited
threads(per process) unlimited
processes(per user)  unlimited


ps -ef |grep kpacma <== get the pid of the process                      
                                                                       
svmon -P <pid of kpacma process >  -O summary=basic,unit=GB            
                                                                       
(this will tell how much of the memory above is used by kpacma.)  


# ps -ef |grep kpacma
    root 14745648        1   0   Jun 30      - 105:36 /opt/IBM/ITM/aix533/pa/bin/kpacma -d -f /opt/IBM/ITM/aix533/pa/config
    root 27262998 26542232   0 16:16:43  pts/2  0:00 grep kpacma
 
root@va10puvtdw001 [/root]
# svmon -P 14745648 -O summary=basic,unit=GB
Unit: GB

-------------------------------------------------------------------------------
     Pid Command          Inuse      Pin     Pgsp  Virtual
14745648 kpacma            1.85     0.03     0.02     1.88


->lsconf | grep Memory
Memory Size: 65536 MB
Good Memory Size: 65536 MB
+ mem0                                                            Memory <========

df
Interested in "% used column.


bootinfo -y (  if it says 64 or 32 bit )
64  <===============


swap -l
device               maj,min        total       free
/dev/hd6              10,  2      1024MB      1019MB  <================


Production ITM Environment

1 Hub server
10 RTEMS where WPA is installed
1 Administrative TEPS
1 R/O TEPS
1 TDW server where DB2, SPA and TPA are installed
1 TCR/Cognos server

Test ITM Environment

1 Hub server where Administrative TEPS is installed as well
1 RTEMS where WPA is installed
1 TDW server where DB2, SPA, TPA and TCR/Cognos are installed


2. Number of Oracle and DB2 agents in ITPA.

We are collecting data for 98 Oracle agents out of 391

We are collecting DB2 data for all 61 DB2 agents


--

pa_id = `ps -ef |grep kpacma|grep -v grep |awk '{print $2 }'`
svmon -P $pa_id -O unit=auto

( 0,5,10,15,20,25,30,35,40,45,50,55 * * * * /tmp/getsvmon.sh>>/tmp/getsvmon.out )<= this is set to 5 mins apart.


Here's what I found in my enviroment , that the "InUse" Memory starts to build up from 0 ...500 M .......1 Gb......... all the way upto 2 GB ~ and when all the  "Available memory  gets used up, the itpa dies


Thursday, May 8, 2014

Explanation of Confidence field being shown on Tivoli Performance Analyzer panel

The Tivoli Performance Analyzer calculates amongst other things - something called Confidence of data during the course of it's computation.

Data for the TPA (Tivoli Performance Analyzer) is gathered from the Tivoli Data Warehouse and here I will write about how the Confidence value shows up on the TEPS GUI when looking at CPU Utilization for Linux OS Agent.

Confidence is the measure of how well the data being calculated is close to each other.

To begin with, the definition

The status output attributes are:
Confidence
Calculates the correlation co-efficient and multiplies it by 100 (R2 * 100) to give
an indication of how accurate the approximated trended value is. This
calculation is a product of the Least Squares Regression method and creates a
number between 0 and 100 where 0 is no confidence and 100 is a perfectly
approximated function. The number gives you a level of confidence in the
trended value calculated, and can help reduce the number of false positives in
situations.

More information can be found at :
http://publib.boulder.ibm.com/infocenter/tivihelp/v15r1/index.jsp?topic=%2Fcom.ibm.itm.doc_6.2.3fp1%2Fitpa%2Fitm_pauser.htm

Let's look at an example where I will discuss about the "CPU Utilization " on the Linux OS Agent.

If the data ( i.e AVG_CPU_Usage_Moving_Average column) in   itmuser."Linux_CPU_Averages" table is consistent- then  we can expect a good confidence level

i.e 100 %

Here I have data for 21 days and the CPU is consistently showing a 100% usage - then  it means the confidence level is high. so I' m 100% confident that the CPU Usage was pegged high all the time.


If I peeked into the TDW database, this is what I found.

AVG_CPU_Usage_Moving_Average
---------------------------------
                           100.00
                           100.00
                           100.00
                           100.00
                           100.00
                           100.00
                           100.00
                           100.00
                           100.00
                           100.00
                           100.00
                           100.00
                           100.00
                           100.00
                           100.00
                           100.00
                           100.00
                           100.00
                           100.00
                           100.00
                           100.00

  21 record(s) selected.


--

Second scenario:

Next, Let's say the CPU was pegged at  35% all the time ?

Here too - I can find that the confidence will be high, since I have seen a good consistency.


AVG_CPU_Usage_Moving_Average
---------------------------------
                            35.00
                            35.00
                            35.00
                            35.00
                            35.00
                            35.00
                            35.00
                            35.00
                            35.00
                            35.00
                            35.00
                            35.00
                            35.00
                            35.00
                            35.00
                            35.00
                            35.00
                            35.00
                            35.00
                            35.00
                            35.00

  21 record(s) selected.

--

3rd scenario:

Lets say I have varying CPU Usage then the confidence drops - as they are not consistent ( or close to each other )

( same samples count, i.e 21 days )


And the backend TDW  is showing that the data is varying ( or not around each other )

AVG_CPU_Usage_Moving_Average
---------------------------------
                            91.83
                            88.25
                            93.95
                            95.57
                            93.18
                            94.44
                            94.07
                            86.73
                            94.92
                            84.38
                            91.34
                            89.53
                            86.69
                            88.48
                            85.30
                            87.13
                            91.86
                            93.69
                            89.88
                            91.66
                            92.33

  21 record(s) selected.


Hope this small tutorial helped you when you are looking at the confidence being rendered on the TEPS GUI.

Monday, April 28, 2014

Stopping and starting TCR 2.1 on RHEL server.

To start TCR 2.1 , you will need the user id and password for tipadmin.


/opt/tipv2Components/TCRComponent/bin


 startTCRserver.sh
Using /opt/tipv2/java/jre/bin/java
ADMU0116I: Tool information is being logged in file
           /opt/tipv2/profiles/TIPProfile/logs/server1/startServer.log
ADMU0128I: Starting tool with the TIPProfile profile
ADMU3100I: Reading configuration for server: server1
ADMU3200I: Server launched. Waiting for initialization status.
ADMU3000I: Server server1 open for e-business; process id is 4747


--
Likewise to stop the TCR backend -
stopTCRserver,sh - and enter the user id and password.

]# stopTCRserver.sh
Using /opt/tipv2/java/jre/bin/java
ADMU0116I: Tool information is being logged in file
           /opt/tipv2/profiles/TIPProfile/logs/server1/stopServer.log
ADMU0128I: Starting tool with the TIPProfile profile
ADMU3100I: Reading configuration for server: server1
Realm/Cell Name: <default>
Username: tipadmin  <======================================================= Enter the user id
Password:                                                                       ADMU3201I: Server stop request issued. Waiting for stop status.
ADMU4000I: Server server1 stop completed.


--

How to run the precheck_tcr to validate that the installation will succeed.

Get the precheck_tcr.zip first.  This is available on the TCR site.

[root@nc911precheck_tcr]# ./prereq_checker.sh "TCR 211"
IBM Prerequisite Scanner
     Version: 1.2.0.Next
     Build  : 20130520
     OS name: Linux
   User Name: root

 Machine Information
 Machine Name: nc9118040059.in.ibm.com
 Serial number:  VMware-42 0f e6 f3 c9 48 c4 29-4a f2 eb 30 1b 1b ea 16


Scenario: Prerequisite Scan


PASS

--
How to resolve some issues during installation.

[root@911 ~]# tail -f TCR211InstallMessage00.log
Jan 20, 2014 1:50:15 PM com.ibm.tivoli.reporting.advanced.cognos.installer.actions.CheckTemporarySpaceAction customInstall
INFO: CTGTRI662I The summary of temporary space: On drive: /tmp; The partition: /; The available space: 8982691840; The required space: 500000000.
Jan 20, 2014 1:53:01 PM com.ibm.tivoli.reporting.advanced.cognos.installer.actions.CheckDiskSpaceAction customInstall
INFO: CTGTRI726I Available disk space: 8,565; Disk space required for installation: 3,106; Disk space required for temp directory: 476;


Next go to /opt/IBM/tivoli/tcr/logs.zip  and run a search on any file (unzip first ) with some errors.
find . -name \* -exec grep -i error {} \;

If there are some libraries missing like 'libXm.so.3',  openmotif - these have to be  downloaded
and installed before proceeding. ( rpm - Uvh <> )

During installation - look at files being created in the root folder. Files like TIPInstaller-00.log, TCR211InstallMessage00.log  give hints of the installation steps.

--
Tuesday, April 22, 2014

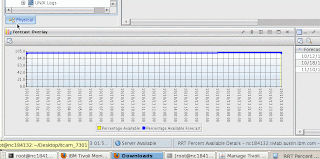
Performance Analyzer visual snapshots when monitoring ITCAM Agents..


In this blog - I will report some of the visuals of the Performance Analyzer when monitoring the ITCAM agents.


Some of the TEP GUI rendering when PA is running and their explanations are captured ?


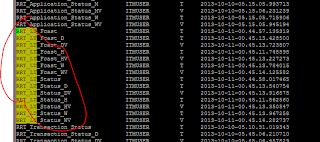
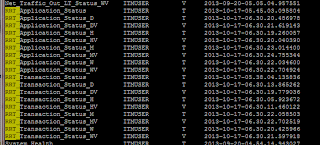
This snapshot below states  the historical tables are not created.

RRT_Transaction_Status H M and W Y etc etc. are not historically created by the SY and the WPA processes.


Here - the history is configured. but the tasks are failing - with the above message,
This is due to the fact that the tables are all empty.
RRT_LT_Fcast and also RRT_transaction-status etc etc. the history tables are not created.


are the only ones.

The error message in the log file is

2013-10-24 09:13:55: Java exception : com.ibm.db2.jcc.am.SqlSyntaxErrorException: DB2 SQL Error: SQLCODE=-204, SQLSTATE=42704, SQLERRMC=ITMUSER.RRT_Transaction_Status_HV, DRIVER=3.62.56
2013-10-24 09:13:55: Stack trace : com.ibm.db2.jcc.am.SqlSyntaxErrorException: DB2 SQL Error: SQLCODE=-204, SQLSTATE=42704, SQLERRMC=ITMUSER.RRT_Transaction_Status_HV, DRIVER=3.62.56
        at com.ibm.db2.jcc.am.fd.a(fd.java:676)
        at com.ibm.db2.jcc.am.fd.a(fd.java:60)
        at com.ibm.db2.jcc.am.fd.a(fd.java:127)
        at com.ibm.db2.jcc.am.jn.c(jn.java:2614)
        at com.ibm.db2.jcc.am.jn.d(jn.java:2602)
        at com.ibm.db2.jcc.am.jn.a(jn.java:2094)
        at com.ibm.db2.jcc.t4.cb.g(cb.java:141)
        at com.ibm.db2.jcc.t4.cb.a(cb.java:41)
        at com.ibm.db2.jcc.t4.q.a(q.java:32)
        at com.ibm.db2.jcc.t4.rb.i(rb.java:135)
        at com.ibm.db2.jcc.am.jn.gb(jn.java:2064)
        at com.ibm.db2.jcc.am.jn.a(jn.java:3089)
        at com.ibm.db2.jcc.am.jn.e(jn.java:1044)
        at com.ibm.db2.jcc.am.jn.execute(jn.java:1028)
        at com.tivoli.kpa.kpaxjdbc.execDirect(Unknown Source)
2013-10-24 09:13:55: Query failed:
2013-10-24 09:13:55: SELECT  "RRT_Transaction_Status_HV"."AVG_Average_Response_Time" , "RRT_Transaction_Status_HV"."Application" , "RRT_Transaction_Status_HV"."Client" , "RRT_Transaction_Status_HV"."Origin_Node" , "RRT_Transaction_Status_HV"."Server" , "RRT_Transaction_Status_HV"."Transaction" , "RRT_Transaction_Status_HV"."Server" , "RRT_Transaction_Status_HV"."Transaction" , "RRT_Transaction_Status_HV"."Client" , "RRT_Transaction_Status_HV"."Application" , "RRT_Transaction_Status_HV"."Origin_Node" , "RRT_Transaction_Status_HV".LAT_WRITETIME , "RRT_Transaction_Status_HV"."TMZDIFF"  FROM itmuser."RRT_Transaction_Status_HV" "RRT_Transaction_Status_HV" WHERE "RRT_Transaction_Status_HV"."Origin_Node" IN ( 'nc184132:T6') ORDER BY  "RRT_Transaction_Status_HV"."Client"  ,  "RRT_Transaction_Status_HV"."Origin_Node"  ,  "RRT_Transaction_Status_HV"."Server"  ,  "RRT_Transaction_Status_HV"."Transaction"  ,  "RRT_Transaction_Status_HV"."Application"  , "RRT_Transaction_Status_HV".LAT_WRITETIME
2013-10-24 09:13:55: Database SQL query failed with error: com.ibm.db2.jcc.am.SqlSyntaxErrorException: DB2 SQL Error: SQLCODE=-204, SQLSTATE=42704, SQLERRMC=ITMUSER.RRT_Transaction_Status_HV, DRIVER=3.62.56

- Is the SPA and WPA processes are running ? If not start it. They are not running possibly why the messages in the kpacma.log is saying that .

- Is the t6 ( RRT ) agent running ?
- Is the task interval within reasonable limits - Can I restart the PA and see that I force a re-run of the task.


--
Does this mean that the PA  files like,   RRT_LT_Fcast and RRT_LT_Status is not created.

The RRT_Transaction_Status is there, but the PA related tables are not created.


how to resolve it,
close the browser or restarting the agent will not fix it.


----
Next.

I added the  managed systems for " RRT % Available."

no change.

Open the Historical configuration  and add the server underneath ?


This below means that the historical collections has the servers under the Available systems above - moved to the left, but there are insufficient data.


This just means that the historical collections has been started, but not enough data points ?
But here I have 57 measurements - so this "Not sufficient data-points " should not have showed up.
Diagnosed this to a sleeping PA process which had no swapspace and seemed like a run-away due to resource crunch on the RHEL server.

At this point , the itmcmd agent stop pa also did not work.
there was no free space either.
so I had to kill the process , restart the process and then I was able to rectify it.


After restarting the PA process. The Not -sufficient data points message went away.

The not sufficient data points should be only if less than 2 measurements.


If you see this message when bringing up the TEPS GUI - then it may mean the database is not started.


Sometimes, it might require restarting the TEMS, TEPS and reconfigure if this error continues.


----

How to resolve this  error below .
The test connection works - but the TEP client is showing an error.


If you look at the kpacma.log there are instances where the log indicates that the PA agent is unable to connect to the TEPS database.

To resolve
Check

su - db2 inst1


db2 => connect to warehous

   Database Connection Information

 Database server        = DB2/LINUX 9.7.4
 SQL authorization ID   = DB2INST1
 Local database alias   = WAREHOUS

db2 => list active databases

                           Active Databases

Database name                              = TEPS
Applications connected currently           = 3
Database path                              = /home/db2inst1/db2inst1/NODE0000/SQL00002/

Database name                              = WAREHOUS
Applications connected currently           = 1
Database path                              = /home/db2inst1/db2inst1/NODE0000/SQL00001/

db2 =>


In the logs ,  you will see that the connection failed - so fix /create the TEPS database first

2013-10-23 09:55:46: Evaluation total time 0 s
2013-10-23 09:55:46: Number of output resources is 0
2013-10-23 09:55:46: Waiting for a period of 60000 ms
2013-10-23 09:56:46: Entering task controller execution loop
2013-10-23 09:56:46: Failed to connect to TEPS database
2013-10-23 09:56:46: Evaluation total time 0 s
2013-10-23 09:56:46: Number of output resources is 0
2013-10-23 09:56:46: Waiting for a period of 60000 ms
2013-10-23 09:57:46: Entering task controller execution loop
2013-10-23 09:57:46: Failed to connect to TEPS database
2013-10-23 09:57:46: Evaluation total time 0 s
2013-10-23 09:57:46: Number of output resources is 0
2013-10-23 09:57:46: Waiting for a period of 60000 ms
2013-10-23 09:58:46: Entering task controller execution loop
2013-10-23 09:58:46: Failed to connect to TEPS database


Next, check that the cq agent created the TEPS database during the configuration.

Next, check that you are using the db2jcc.jar and the db2jcc_license.jar during the PA configuration - to resolve it.
Adding more jar files may also cause it.
See the kpacma.log where it exactly tells the jar files used for configuration.

2013-10-24 04:11:54: Loading tasksimp
2013-10-24 04:11:54: tasksimp is build 120551 (Feb 24 2012)
2013-10-24 04:11:54: TaskImporter starting
2013-10-24 04:11:54: TaskImporter finished
2013-10-24 04:11:54: Loaded tasksimp successfully
2013-10-24 04:11:54: Agent running - 6 subagents active
2013-10-24 04:11:54: TImpMainTask: KPA_JAVA_HOME is /opt/IBM/ITM/JRE/li6263
2013-10-24 04:11:54: TImpMainTask: CANDLEHOME is /opt/IBM/ITM
2013-10-24 04:11:54: TImpMainTask: config dir /opt/IBM/ITM/li6263/pa/config
2013-10-24 04:11:54: TImpMainTask: root dir /opt/IBM/ITM/li6263/pa/bin/
2013-10-24 04:11:54: TImpMainTask: todeploy dir /opt/IBM/ITM/li6263/pa/config/todeploy
2013-10-24 04:11:54: TImpMainTask: deployed dir /opt/IBM/ITM/li6263/pa/config/deployed
2013-10-24 04:11:54: Using jvm classpath /opt/IBM/ITM/li6263/pa/bin/kpaxjdbc.jar:/opt/ibm/db2/V9.7/java/db2jcc.jar
2013-10-24 04:11:54: TImpMainTask: Trying file ..
2013-10-24 04:11:54: TImpMainTask: Trying file .
2013-10-24 04:11:54: GenIraAgent::TakeSample(WRT_LT_Status) returns 0 rows in 0 s


----

Monday, April 21, 2014

Changing the task interval for PA tasks.

Changing the PA Task Interval - by command line.


First convert them to Identifiers, so that we can easily track it.

Update  itmuser."KPATASKS"   set  itmuser."KPATASKS"."TASKINT" = 120 where itmuser."KPATASKS"."ID" like '-261ac283:1112f4c4abc:-6bee'
Update  itmuser."KPATASKS"   set  itmuser."KPATASKS"."TASKINT" = 120 where itmuser."KPATASKS"."ID" like '-261ac283:1112f4c4abc:-6cf7'
Update  itmuser."KPATASKS"   set  itmuser."KPATASKS"."TASKINT" = 120 where itmuser."KPATASKS"."ID" like '-261ac283:1112f4c4abc:-6df8'
Update  itmuser."KPATASKS"   set  itmuser."KPATASKS"."TASKINT" = 120 where itmuser."KPATASKS"."ID" like '-261ac283:1112f4c4abc:-6efd'
Update  itmuser."KPATASKS"   set  itmuser."KPATASKS"."TASKINT" = 120 where itmuser."KPATASKS"."ID" like '-261ac283:1112f4c4abc:-7058'
Update  itmuser."KPATASKS"   set  itmuser."KPATASKS"."TASKINT" = 120 where itmuser."KPATASKS"."ID" like '-261ac283:1112f4c4abc:-7201'
Update  itmuser."KPATASKS"   set  itmuser."KPATASKS"."TASKINT" = 120 where itmuser."KPATASKS"."ID" like '-261ac283:1112f4c4abc:-75d3'
Update  itmuser."KPATASKS"   set  itmuser."KPATASKS"."TASKINT" = 120 where itmuser."KPATASKS"."ID" like '-261ac283:1112f4c4abc:-7c9f'
Update  itmuser."KPATASKS"   set  itmuser."KPATASKS"."TASKINT" = 120 where itmuser."KPATASKS"."ID" like '10cd562:11149a61178:-7964'
Update  itmuser."KPATASKS"   set  itmuser."KPATASKS"."TASKINT" = 120 where itmuser."KPATASKS"."ID" like '2716a58b:11149f27bff:-7a99'
Update  itmuser."KPATASKS"   set  itmuser."KPATASKS"."TASKINT" = 120 where itmuser."KPATASKS"."ID" like '346f65a6:1112b223178:-7eab'


Get the columns of KPATASKS:


Column name          
---------------------------
PREID                           
ISACTIVE                      
TASKINT                       
MODTYPE                    
TASKNAME                  
EXPRESSION              
UPDATETIME              
STARTUPRUN             
TASKDESC                  
ID                             

  10 record(s) selected.

The TaskDesc and Taskname are not readable elements :) . They look similar but not understandable.

  - On a side note to update all to inactive - do this.

To just update one of the tasks to 0 ( inactive )

# initially this will show '1'
select  itmuser."KPATASKS"."ID" , itmuser."KPATASKS"."ISACTIVE" from itmuser."KPATASKS"  where itmuser."KPATASKS"."ID" = '-261ac283:1112f4c4abc:-7058'

1

# update this to a 0
Update  itmuser."KPATASKS"   set  itmuser."KPATASKS"."ISACTIVE" = 0   where itmuser."KPATASKS"."ID" = '-261ac283:1112f4c4abc:-7058'

DB20000I  The SQL command completed successfully.

# Check again  to see that it is 0
select  itmuser."KPATASKS"."ID" , itmuser."KPATASKS"."ISACTIVE" from itmuser."KPATASKS"  where itmuser."KPATASKS"."ID" = '-261ac283:1112f4c4abc:-7058'


To update all the tasks  inactive :
Update  itmuser."KPATASKS"   set  itmuser."KPATASKS"."ISACTIVE" = 0


To update just the Linux agent tasks to active :

Update  itmuser."KPATASKS"   set  itmuser."KPATASKS"."ISACTIVE" = 1 where itmuser."KPATASKS"."ID" like '-261ac283:1112f4c4abc:-6bee'
Update  itmuser."KPATASKS"   set  itmuser."KPATASKS"."ISACTIVE" = 1 where itmuser."KPATASKS"."ID" like '-261ac283:1112f4c4abc:-6cf7'
Update  itmuser."KPATASKS"   set  itmuser."KPATASKS"."ISACTIVE" = 1 where itmuser."KPATASKS"."ID" like '-261ac283:1112f4c4abc:-6df8'
Update  itmuser."KPATASKS"   set  itmuser."KPATASKS"."ISACTIVE" = 1 where itmuser."KPATASKS"."ID" like '-261ac283:1112f4c4abc:-6efd'
Update  itmuser."KPATASKS"   set  itmuser."KPATASKS"."ISACTIVE" = 1 where itmuser."KPATASKS"."ID" like '-261ac283:1112f4c4abc:-7058'
Update  itmuser."KPATASKS"   set  itmuser."KPATASKS"."ISACTIVE" = 1 where itmuser."KPATASKS"."ID" like '-261ac283:1112f4c4abc:-7201'
Update  itmuser."KPATASKS"   set  itmuser."KPATASKS"."ISACTIVE" = 1 where itmuser."KPATASKS"."ID" like '-261ac283:1112f4c4abc:-75d3'
Update  itmuser."KPATASKS"   set  itmuser."KPATASKS"."ISACTIVE" = 1 where itmuser."KPATASKS"."ID" like '-261ac283:1112f4c4abc:-7c9f'
Update  itmuser."KPATASKS"   set  itmuser."KPATASKS"."ISACTIVE" = 1 where itmuser."KPATASKS"."ID" like '10cd562:11149a61178:-7964'
Update  itmuser."KPATASKS"   set  itmuser."KPATASKS"."ISACTIVE" = 1 where itmuser."KPATASKS"."ID" like '2716a58b:11149f27bff:-7a99'
Update  itmuser."KPATASKS"   set  itmuser."KPATASKS"."ISACTIVE" = 1 where itmuser."KPATASKS"."ID" like '346f65a6:1112b223178:-7eab'
 
To delete all the tasks :

delete from itmuser."KPATASKS" 

will remove from the PA config panel as well as the tasks list panel in TEPS.   

To update the Task Interval ??  TASKINT to 2 minutes ( 180 secs )

select itmuser."KPATASKS"."TASKINT", itmuser."KPATASKS"."ID"  from itmuser."KPATASKS" where itmuser."KPATASKS"."ISACTIVE" = 1

# this is only for the  DiskUtilizaton  (Linux )

Update  itmuser."KPATASKS"   set  itmuser."KPATASKS"."TASKINT" = 120   where itmuser."KPATASKS"."ID" = '-261ac283:1112f4c4abc:-6efd'


Wednesday, April 9, 2014

My experiments in creating ITCAM RRT scripts


Some pre-reqs, the following processes have to be running.

Or else the server name will not appear in one of the configuration panels.

[root@nc9118041057 bin]# cinfo -r

*********** Thu Oct 17 06:19:49 EDT 2013 ******************
User: root Groups: root bin daemon sys adm disk wheel
Host name : nc9118041057         Installer Lvl:06.30.02.00
CandleHome: /opt/IBM/ITM
***********************************************************
Host          Prod  PID    Owner  Start  ID    ..Status
nc9118041057  ms    7415   root   Oct11  TEMS  ...running
nc9118041057  hd    7769   root   Oct11  None  ...running
nc9118041057  kf    9041   root   Oct11  None  ...running
nc9118041057  lz    9752   root   Oct11  None  ...running
nc9118041057  cq    27376  root   Oct11  None  ...running
nc9118041057  t4    15187  root   05:21  None  ...running
nc9118041057  t6    795    root   05:23  None  ...running
nc9118041057  t3    17018  root   05:25  None  ...running
nc9118041057  t5    633    root   05:26  None  ...running
nc9118041057  sy    26358  root   05:56  None  ...running
nc9118041057  pa    2469   root   06:19  None  ...running

1. How to get the RRT CRT and WRT Fcast tables created.

They get automatically created - but they may not have data.

The summarized tables - will be created but can contain 0 zero data.

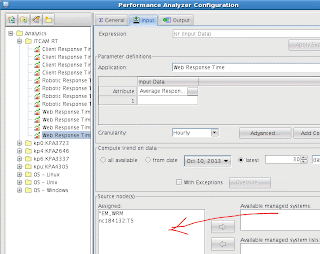
The WRT and RRT LT Status and Fcast tables    **** got created ******  after these servers from right to left were configured.


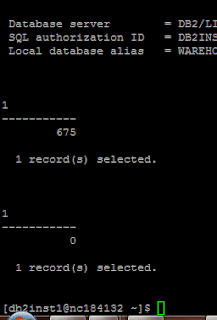
2. If the RRT_LT_Fcast, and RRT_LT_Status has data in the DB ( 675 and so on ), but the summarized tables
RRT_LT_Fcast_H,
RRT_LT_Status_H  does not ??
why ?
This is because the Warehouse interval timing has to be changed to reasonable time - or else wait for the Warehouse collection interval for the records tobe seen.

Samples below.


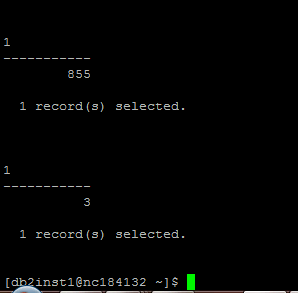
count from RRT_LT_Status and RRT_LT_Fcast show  675 and 0 ??


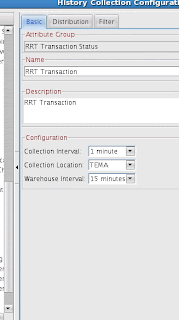
Change the frequency of WPA as shown.


Change the frequency of uploads  to 1 minute and 15 minutes and wait for 15 minutes.


How to get the RRT_Transaction_Status Summarized tables created.


Here you will see that the History Summarized tables are not created.

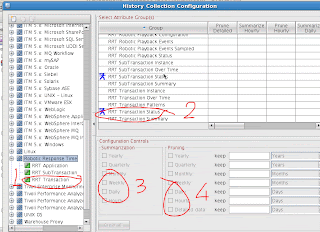
So set the SPA and Pruning attributes.


Go to history panel and check that the Summarization and others are configured.


wait for a few minutes.

you will see that the summarized tables got created.


Once I changed it for RRT and WRT -  within few minutes - I was able to see the data in the Hourly tables.


3. If the Transaction _Over_TIme   issue comes up
then Transaction_Over_Time
                the change for RRT and the WRT is in the file
                /opt/IBM/ITM/li6263/cq/sqllib

                kpi_kcj.sql
                this is our file                  in here - replace the occurences of RRT_Transaction_Over_Time
                there are 4 lines ( but each line has 2 such words )
                grep -i RRT_Transaction_Ovcer_Time will tell - 4 lines.
                but If I search in vi - it will be 8 entries - little confusing.
                I hve to replace them to RRT_Transaction_Status


Rebuild the cq
start cq
and then bring up the browser
and you wll see that the charts are rendered oK ?


4. How to install the 7.3.0.1

First install the ITCAm  7.3.0 and then install the ITCAM  7.3.0.1 IF0020  from the IBM Fix Central
get 7.3.0.1-TIV-CAMRT-IF0020

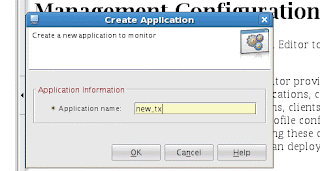
5 . How to create a RRT Script.


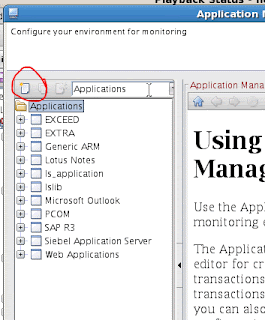
Click on the briefcase button.


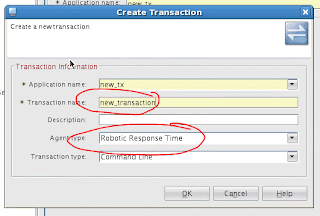
Click on the "Create New Transaction"


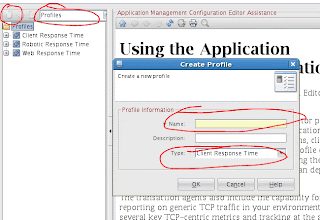
Now right click on the newly created item and "Create new transaction"


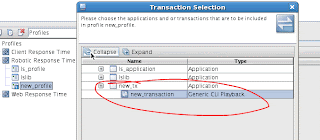
Click on Profiles and attach this to it.


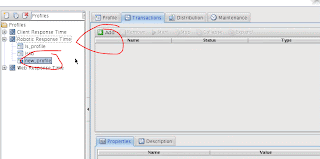
Go to Transaction tab and then click on "ADD".


Go to the lower panel and change the script interval to 1 minute - meaning to run every minute.

Go to Distribution and attach the EM_RBOT and the server under to the left panel.

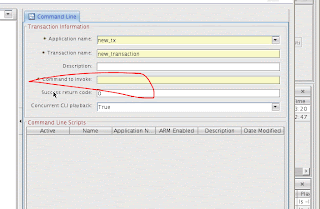
Go to the Application panel and then  enter the "Command to invoke ": and enter your command to be run.


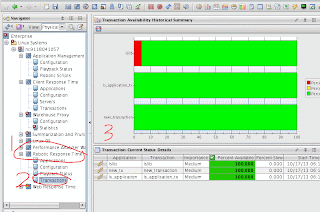
This lists the new transaction.

Now, check if the transaction tables in DB were created.

This should take care of the creation of history and tasks for ITCAM agents.

Tuesday, April 1, 2014

Creating history collections attributes for Windows OS agent on ITM


In this blog - I will tell how to get the list of all the "ITM " NT agent attribute groups supported on a windows 2012 server.

tepslogin as an argument is key/important ' to the command.

c:\<>>tacmd tepslogin -s %COMPUTERNAME% -u sysadmin

c:\<>> tacmd histlistattributegroups -t nt


KUIHLA006I Validating user credentials...
Group Name                                 Status
Active Server Pages                        Not Configured
DHCP Server                                Not Configured
DNS Dynamic Update                         Not Configured
DNS Memory                                 Not Configured
DNS Query                                  Not Configured
DNS WINS                                   Not Configured
DNS Zone Transfer                          Not Configured
FTP Server Statistics                      Not Configured
FTP Service                                Not Configured
Gopher Service                             Not Configured
HTTP Content Index                         Not Configured
HTTP Service                               Not Configured
ICMP Statistics                            Not Configured
IIS Statistics                             Not Configured
Indexing Service                           Not Configured
Indexing Service Filter                    Not Configured
IP Statistics                              Not Configured
Job Object                                 Not Configured
Job Object Details                         Not Configured
KCA Agent Active Runtime Status            Not Configured
KCA Agent Availability Management Status   Not Configured
KCA Alerts Table                           Not Configured
KCA Configuration Information              Not Configured
MSMQ Information Store                     Not Configured
MSMQ Queue                                 Not Configured
MSMQ Service                               Not Configured
MSMQ Sessions                              Not Configured
Network Interface                          Not Configured
Network Segment                            Not Configured
NNTP Commands                              Not Configured
NNTP Server                                Not Configured
NT BIOS Information                        Not Configured
NT Cache                                   Not Configured
NT Computer Information                    Not Configured
NT Device Dependencies                     Not Configured
NT Devices                                 Not Configured
NT Event Log                               Not Configured
NT IP Address                              Not Configured
NT Job Object Details                      Not Configured
NT Logical Disk                            Not Configured
NT Memory                                  Not Configured
NT Memory 64                               Not Configured
NT Monitored Logs Report                   Not Configured
NT Network Interface                       Not Configured
NT Network Port                            Not Configured
NT Objects                                 Not Configured
NT Paging File                             Not Configured
NT Physical Disk                           Not Configured
NT Print Job                               Not Configured
NT Printer                                 Not Configured
NT Process                                 Not Configured
NT Process 64                              Not Configured
NT Processor                               Not Configured
NT Processor Information                   Not Configured
NT Processor Summary                       Not Configured
NT Redirector                              Not Configured
NT Server                                  Not Configured
NT Server Work Queues                      Not Configured
NT Server Work Queues 64                   Not Configured
NT Service Dependencies                    Not Configured
NT Services                                Not Configured
NT System                                  Not Configured
NT Thread                                  Not Configured
Print Queue                                Not Configured
Process IO                                 Not Configured
RAS Port                                   Not Configured
RAS Total                                  Not Configured
SMTP Server                                Not Configured
TCP Statistics                             Not Configured
UDP Statistics                             Not Configured
VM Memory                                  Not Configured
VM Processor                               Not Configured
Web Service                                Not Configured


and to configure the windows NT atributes for historical collecton on ITM use this script below.

Call it as histcoll_knt.bat

@echo off
setlocal

set COLINT=1m
set WHINT=15m

tacmd tepslogin -s %COMPUTERNAME% -u sysadmin

rem tacmd histcreatecollection -a "
tacmd histcreatecollection -a  "IVT_Logical_Disk"                -o  "NT Logical Disk" -t KNT -c %COLINT% -i %WHINT%
tacmd histcreatecollection -a  "IVT_Physical_Disk"               -o  "NT Physical Disk" -t KNT -c %COLINT% -i %WHINT%
tacmd histcreatecollection -a  "IVT_NT_Memory"                   -o  "NT Memory"       -t KNT -c %COLINT% -i %WHINT%
tacmd histcreatecollection -a  "IVT_NT_Network_Interface"        -o  "NT Network Interface"       -t KNT -c %COLINT% -i %WHINT%
tacmd histcreatecollection -a  "IVT_NT_Process"                  -o  "NT Process"       -t KNT -c %COLINT% -i %WHINT%
tacmd histcreatecollection -a  "IVT_Job_Object_Details"          -o  "Job Object Details"       -t KNT -c %COLINT% -i %WHINT%
tacmd histcreatecollection -a  "IVT_NT_Server_Work_Queues"       -o  "NT Server Work Queues"       -t KNT -c %COLINT% -i %WHINT%

rem now start the cllection.

tacmd histstartcollection -a  IVT_Logical_Disk              -m *NT_SYSTEM
tacmd histstartcollection -a  IVT_Physical_Disk             -m *NT_SYSTEM
tacmd histstartcollection -a  IVT_NT_Memory                 -m *NT_SYSTEM
tacmd histstartcollection -a  IVT_NT_Network_Interface      -m *NT_SYSTEM
tacmd histstartcollection -a  IVT_NT_Process                -m *NT_SYSTEM
tacmd histstartcollection -a  IVT_Job_Object_Details        -m *NT_SYSTEM
tacmd histstartcollection -a  IVT_NT_Server_Work_Queues     -m *NT_SYSTEM

Open the historical collections panel on the TEPS GUI and go to Windows OS to view the newly created attributes.


Once this is enabled, and assuming that the Windows OS agent is started and collecting  data, the Database should start populating data .