Note : Views are my own and not that of my employer.
Here I am giving some tips on installation of the SPSS component on ITM . ( IBM Tivoli Monitoring)
ITM support both the Linear Trending and the Non-Linear trending of data.
For more on the product : refer to
http://www-01.ibm.com/software/analytics/spss/support/spss_license.html
(SPSS = Statistical Package for Social Sciences )
Below you will see how to install this, and also some graphs of the resources from a beginner stand point.
( SPSS component is a add-on component license that one has to buy to install on top of ITM which will give the Non -Linear trending.)
The Linear trending however does not require any special license and will be installed as part of the ITM.
SPSS gives the ability to do Non-linear predictive analysis and is better than Linear prediction.
Licensing:
http://www-01.ibm.com/software/analytics/spss/support/spss_license.html
Product Downloads for evaluation :
http://www-01.ibm.com/software/analytics/spss/downloads/
Installing SPSS component on a Linux Server RHEL 64 bit
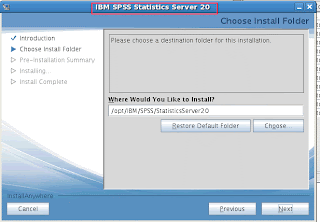
Download the SPSS package, and unzip and start the installer ( X session - required )
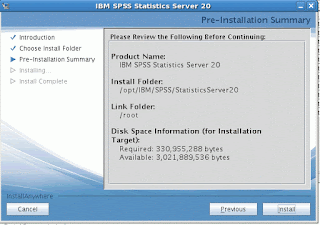
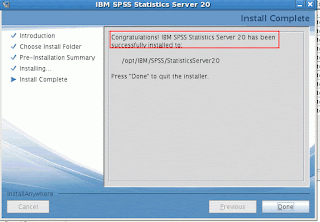
Some installation snapshots are put up here for easier installation process.
Go to MEMS Tool ( or the itmcmd manage ) and configure the ITPA .

Go up to the configuration page and validate the SPSS path.
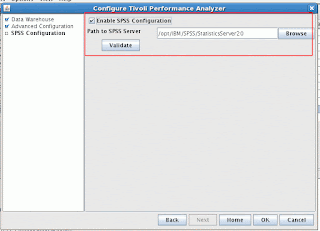
Click on Validate - if the default path was set during the installation, then it will prompt a valid response.

Save and restart the agent.
Now, on the TEPS GUI, open the Performance Analyzer configuration button.
and drill down to the OS Linux - you will see the new Non- linear Analytic tasks being configured.
Here in this example, I concentrate on Linux OS only.
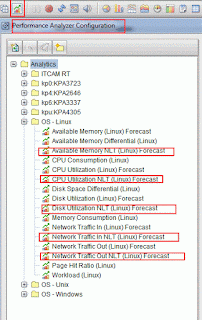
The new tasks end with the NLT suffix indicates that the Non-Linear tasks are created.
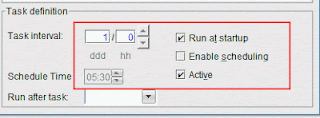
Click on the tasks and check that the 'run at startup' button is set, ( If the active button is not set - then enable this option to activate it )
Set the task interval to desired time ( in my case I set it to 1 hr- so that this task runs every 1 hr )
(Start with one of the NLT Tasks and then replicate this to other NLT tasks )
Click on the Distribution tab, and select the managed servers and move it under Assigned. So that the collections happen for this managed servers.
Next,
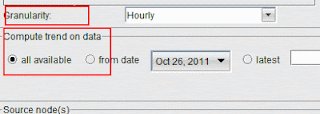
( my choice ) set the granularity to Hourly.
and Compute trend on 'all available data'
Click 'Apply',
Now. assuming that the historical collections is configured. check the MOS WOS panel.
This lists the different states the analytical tasks are in.
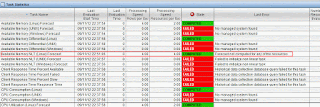
The possible messages are COMPUTED or FAILED.
Computed means that the resource was computed, but there was not.

To speed things up - we can start and stop the PA ( since we have configured the NLT task to 'Run at Startup' )
Let's take just the Disk Utilization for example.
Go to Performance Analyzer Configuration window and click on Disk Utilization, The input data selection window pops up.
Check if the History collection have been set up for this attribute.
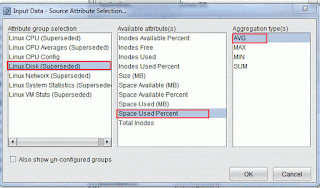
(If not, Go to History collection and check that the Linux Disk (Superseded ) is set to collect history data )
If the data collection is in progress and the Disk Utilization NLT is computed, this is the message that should show up if your cursor is on
Performance Analyzer Warehouse Agent.


If the state is computed. move the cursor to

and click on the 'Workspace Gallery'
This will pop-up a new window. In this select the
'Disk Utilization Non Linear Trending ' button .
This should render the Disk Utilization Non Linear report.
This is for Space Used Percent Input attribute.
A sample graph for "Space Used Percent' would be like

indicating that the disk forecast based on the past data will be at 10%.
Now, I change the input attribute from Space Used Percent to 'Space Available'
History Collection Configuration :
Tips to check if the NLT historical collection is configured.
Go to History Collection and click on Tivoli Perf domain for OS Agent:
and verify
a) Collection Interval ( this means that the collection is being done - once a day and also saved in the Agent once a day )
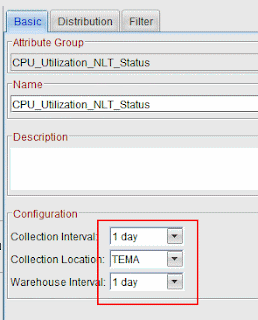
and just to speed it up
set the Collection interval to 5 minutes and move it to Warehouse DB once every 15 minutes.
Click on the Distribution tab and remember to assign the server under the "Start Collection on"
Repeat this for all the resource NLT tasks like CPU, DIsk, Memory etc.
Here I am giving some tips on installation of the SPSS component on ITM . ( IBM Tivoli Monitoring)
ITM support both the Linear Trending and the Non-Linear trending of data.
For more on the product : refer to
http://www-01.ibm.com/software/analytics/spss/support/spss_license.html
(SPSS = Statistical Package for Social Sciences )
Below you will see how to install this, and also some graphs of the resources from a beginner stand point.
( SPSS component is a add-on component license that one has to buy to install on top of ITM which will give the Non -Linear trending.)
The Linear trending however does not require any special license and will be installed as part of the ITM.
SPSS gives the ability to do Non-linear predictive analysis and is better than Linear prediction.
Licensing:
http://www-01.ibm.com/software/analytics/spss/support/spss_license.html
Product Downloads for evaluation :
http://www-01.ibm.com/software/analytics/spss/downloads/
Installing SPSS component on a Linux Server RHEL 64 bit
Download the SPSS package, and unzip and start the installer ( X session - required )
Some installation snapshots are put up here for easier installation process.


Go to MEMS Tool ( or the itmcmd manage ) and configure the ITPA .

Go up to the configuration page and validate the SPSS path.

Click on Validate - if the default path was set during the installation, then it will prompt a valid response.

Save and restart the agent.
Now, on the TEPS GUI, open the Performance Analyzer configuration button.
and drill down to the OS Linux - you will see the new Non- linear Analytic tasks being configured.
Here in this example, I concentrate on Linux OS only.

The new tasks end with the NLT suffix indicates that the Non-Linear tasks are created.
Click on the tasks and check that the 'run at startup' button is set, ( If the active button is not set - then enable this option to activate it )
Set the task interval to desired time ( in my case I set it to 1 hr- so that this task runs every 1 hr )
(Start with one of the NLT Tasks and then replicate this to other NLT tasks )

Click on the Distribution tab, and select the managed servers and move it under Assigned. So that the collections happen for this managed servers.
Next,
( my choice ) set the granularity to Hourly.
and Compute trend on 'all available data'

Click 'Apply',
Now. assuming that the historical collections is configured. check the MOS WOS panel.
This lists the different states the analytical tasks are in.

The possible messages are COMPUTED or FAILED.
Computed means that the resource was computed, but there was not.

To speed things up - we can start and stop the PA ( since we have configured the NLT task to 'Run at Startup' )
Let's take just the Disk Utilization for example.
Go to Performance Analyzer Configuration window and click on Disk Utilization, The input data selection window pops up.
Check if the History collection have been set up for this attribute.

(If not, Go to History collection and check that the Linux Disk (Superseded ) is set to collect history data )
If the data collection is in progress and the Disk Utilization NLT is computed, this is the message that should show up if your cursor is on
Performance Analyzer Warehouse Agent.


If the state is computed. move the cursor to

and click on the 'Workspace Gallery'

This will pop-up a new window. In this select the
'Disk Utilization Non Linear Trending ' button .
This should render the Disk Utilization Non Linear report.
This is for Space Used Percent Input attribute.
A sample graph for "Space Used Percent' would be like

indicating that the disk forecast based on the past data will be at 10%.
Now, I change the input attribute from Space Used Percent to 'Space Available'
History Collection Configuration :
Tips to check if the NLT historical collection is configured.
Go to History Collection and click on Tivoli Perf domain for OS Agent:
and verify
a) Collection Interval ( this means that the collection is being done - once a day and also saved in the Agent once a day )

and just to speed it up
set the Collection interval to 5 minutes and move it to Warehouse DB once every 15 minutes.
Click on the Distribution tab and remember to assign the server under the "Start Collection on"
Repeat this for all the resource NLT tasks like CPU, DIsk, Memory etc.
No comments:
Post a Comment