This blog explains how the confidence in PA is being calculated.
Often times you will see the value varying even though you have good range of data being calculated.
The confidence value depends on the values in the TDW for the analytical task being calculated, and if the values are varying then the confidence will proportionately vary.
Higher the variance - lower the confidence.
Likewise - if the values are close to each other - then the confidence will come up close or higher than 90%/
( the other way I look at it is, if I know that the values are same or approximately the same each time the reading was taken and If I can select that range in the PA config window - then I can get a good confidence value , but for this I need to know what are the values in the Tivoli Data Warehouse )
Below is my experiment on Average Memory Utilization Analytical task for 11 days and is captured below on how I was able to increase the confidence by hand editing or simulating good data.
This is not dependent on the number of samples - but on the values.
--
Before:
I have 11 day worth of data for the Average Memory free, with varying values - and the calculated confidence was 25, since the "average memory free" was varying as shown below.
The snap shot below is the TDW data contents, The column on the left is the day representation split as follows 1 - 13 - 09 - 06 -23-date,
( i.e Sep 6th 2013 and upto Sep 18th 2013. )
--
After:
Now, let's change the value to a constant for all the days - by hand -editing the value in the TDW to 369.45 and watch that the Confidence goes to 100.
Watch the confidence jump to 100
Some supporting notes :
This was tested on RHEL 5. and DB2 housing the TDW, and all PA analytical tasks were running
To enable a quicker visual - I had to turn the analytical task to run every minute and watched the <ITM LOGS>kpacma.log so that it would refresh faster.
Thursday, September 19, 2013
Tuesday, September 17, 2013
Selecting range of data to calculate the Confidence in Tivoli Performance Analyzer.
The confidence of the data for the Performance Analyzer for the task attributes are based on the inputs for the domain from the Tivoli Data Warehouse.
This confidence is listed in the TEP GUI whenever the user opts to view the analysis of the attribute computed by the Performance Analyzer.
e.g: Let;s say the user wants to view the CPU performance of a certain configured agent, ( Assuming that the historical collection was setup ), data will show up as graphs and charts along with forecast and status details.
User would like to see the confidence in the data as well - This is calculated based on the Least Square Regression algorithm ( which I will try not to get into here )
The confidence is great when there are no breaks in data. but low when there is disruption of data and so on.
Here I will go about how to change the calculation in the Tivoli Performance Analyzer Configuration window - on how to select a set of data for this calculation.
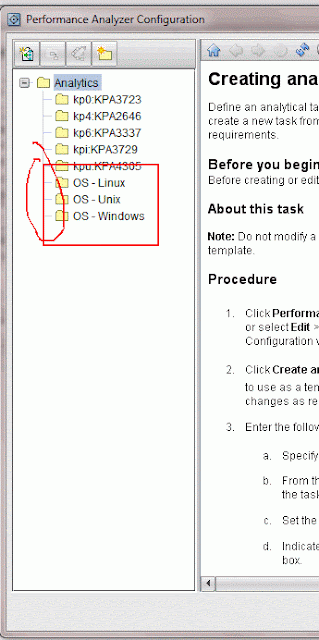
Open the PA configuration window and I have picked the CPU Utilization for Linux as my demo.
Click on "Add constraint " in the PA configuration button -> Input tab as shown below.
Click on "Add Constraint" and in this example I am tweaking the CPU Utilization ( Linux ) and you can change or choose and pick the attributes based on your business needs. I chose the "Linux CPU Averages" -> and "Time Stamp" and chose the range I wanted to start computing the data collection.
I suggest a couple of tries - trial and error to get the confidence level showing up to your business needs.
First option is to just add one constraint, and once you are familiar - you can add multiple constraints and set the date range.
Here are some samples that I tried. ( you can experiment it based on this and then use a scheme that fits )
- Set the Granularity to "Hourly"
- Click on Add Constraint -> Chose Linux CPU Averages and "Time Stamp"
- Click on the window just below the Time stamp and chose the date ( in my case I said 'let's get all data from Sep 16th 12:00 )
- Click on Apply. This should set the task when run to pick data from Sep 16th onwards.
- let the task run.
Some more tips to see the results faster. ( this is optional - but just a suggestion )
1. Set the task to run every often ( I tried running it every minute ) just to see the reaction.
2. Turn the debugging on from Info to Debug - so that I was able to see the logs when the task ran. ( this is optional - but just a suggestion )
If you do this - then remember to stop and start the PA agent ( itmcmd agent stop pa and start pa )
AgentIdUniqueId__file=local.cfg
ConsolePassword__file=local.cfg
DisableVACM=true
EngineBoots__file=local.cfg
LogCount=3
LogFile=/opt/IBM/ITM/logs/kpacma.log
LogLevel=Debug <==============
LogSize=10000000
NotificationQueueLimit=50
UdpPort=-1
3. View the traces - kpacma.log, ( this is optional - but just a suggestion )
This is what shows up when the task is run, Here I set the 2 constraints from the front end to watch for everything from 7:00 PM to 8:00 PM on the 16th Sep 2013.
The 1130916190000000
= 1 -13-09-16---19-00-00
= Ignore the first digit, 2013 Sep 16, 7:00 PM
likewise the
'1130916120000000'
is
1-13-09-16-20-00 00 essentially 8 PM.
( There will be just 1 timestamp if there is 1 constraint configured. )
Another example : 2013 Sep 16 12;00 AM to 7 PM
2013-09-17 03:12:09: SELECT "Linux_CPU_Averages_HV"."AVG_CPU_Usage_Moving_Average" , "Linux_CPU_Averages_HV"."Timestamp" , "Linux_CPU_Averages_HV"."TMZDIFF" , "Linux_CPU_Averages_HV"."Timestamp" , "Linux_CPU_Averages_HV"."TMZDIFF" , "Linux_CPU_Averages_HV"."System_Name" , "Linux_CPU_Averages_HV"."System_Name" , "Linux_CPU_Averages_HV".WRITETIME , "Linux_CPU_Averages_HV"."TMZDIFF" FROM itmuser."Linux_CPU_Averages_HV" "Linux_CPU_Averages_HV" WHERE "Linux_CPU_Averages_HV"."System_Name" IN ( 'nc9118041057:LZ') AND ("Linux_CPU_Averages_HV"."Timestamp" > '1130916000000000') AND ("Linux_CPU_Averages_HV"."Timestamp" < '1130916190000000') ORDER BY "Linux_CPU_Averages_HV"."System_Name" , "Linux_CPU_Averages_HV".WRITETIME
2013-09-17 03:12:09: All 19 measurement(s) processed and found 1 result(s)
Things to watch:
- See that you hit the Apply button after making changes to the constraints so that the rule gets applied.
- The "Forecast Overlay" panel in the GUI - does not change the graphs to the "From date" and the "End date". Only the calculations of the confidence, strength and number of records change.
- Check that the task is set to something reasonable time frame so that you can watch the effects of the changes. ( I tried it for every minute - once I got it running - changed the run interval back to the original setting )
- to check if the data is being pulled enable the logging , stop start agent and trace the kpacma.log . The logs can get big if you have a lot of tasks running and difficult to watch. so try greping appropriate task and the server.
Hope this small tutorial helped.
Monday, September 16, 2013
PA - Analysis of "Total Number of Measurements" on the TEP Client for the Performance Analyzer task.
The calculation of the number of records for the task (in this case I will discuss the CPU Utilization and for Linux ) for "Total Measurements" is coming from Tivoli Data Warehouse.
The blog explains how this came about and what are the other possible measurements that can be obtained in the Performance Analyzer
A snapshot of the TEP Client showing the Performance Analyzer tasks is shown below.
To double check this, login to the Database ( in this case DB2 ) and run this query for CPU Utilization for Summarized data for Hourly.
connect to WAREHOUS
select count(*) from itmuser."Linux_CPU_Averages_H"
But before this - one has to check to what granularity has the user configured the task measurements in the PA configuration window.
For this - open the Performance Analyzer configuration and view the granularity. (here it is set to Hourly - so the query will be
Linux_CPU_Averages_H
Had the granularity been set to Daily - then the query would have a suffix of "D", Likewise a granularity set to "Weekly, then the query would have a suffix of "W" and so on.
Thursday, September 12, 2013
paconf.jar - export/createDB/ execSQL
Often times there is a need for recreating the Performance Analyzer configuration Database.
Here I will write about some of my experiments with the command.
The command line to run it is ( on linux 64 bit ) ( first cd to the folder where the paconf.jar is present )
/opt/IBM/ITM/JRE/li6263/bin/java -cp paconf.jar:/opt/IBM/ITM/classes/kjrall.jar:/opt/ibm/db2/V9.7/java/db2jcc.jar:/opt/ibm/db2/V9.7/java/db2jcc_license_cu.jar com.ibm.tivoli.pa.config.PAConfigMain
The various options are :
java -jar paconf.jar [-export {taskfile} [-domain domainCode] |-createDB|-destroyDB|-cleanInitDB|-gui|-bareExecSQL|-execSQL taskfile-updateTables]
-export Export tasks to a file. Default to: kpa_tasks.sql. Optional -domain parameter specifies which domain tasks shoud be exported. Use 000 to export tasks not assigned to any domain.
-createDB Create the PA DB if it is not there
-destroyDB Drop all tables in TEPS DB created by ITPA
-cleanInitDB Re-create the PA DB. Same as -destroyDB then -createDB
-gui Bring up the bare bone GUI (not fully functional
-bareExecSQL Executing SQL statements from specified file. Tasks active/inactive state will not be preserved.
-execSQL Executing SQL statements from specified file. Tasks active/inactive state will be preserved.
-updateTables Update tables to the latest version (create nonexisting ones)
-gui - does not work ( not complete )
My experiments have been with mostly -execSQL, -createDB, -cleanInitDB
-createDB on a RHEL 64 bit: ( this will zap the contents of the tables to 0, all tables will be created though empty. )
/opt/IBM/ITM/JRE/li6263/bin/java -cp paconf.jar:/opt/IBM/ITM/classes/kjrall.jar:/opt/ibm/db2/V9.7/java/db2jcc.jar:/opt/ibm/db2/V9.7/java/db2jcc_license_cu.jar com.ibm.tivoli.pa.config.PAConfigMain -createDB
-destroyDB will drop the tables ( select count(*) from itmuser."KPATASKS" will say SQL0204N "ITMUSER.KPATASKS" is an undefined name. SQLSTATE=42704
/opt/IBM/ITM/JRE/li6263/bin/java -cp paconf.jar:/opt/IBM/ITM/classes/kjrall.jar:/opt/ibm/db2/V9.7/java/db2jcc.jar:/opt/ibm/db2/V9.7/java/db2jcc_license_cu.jar com.ibm.tivoli.pa.config.PAConfigMain -destroyDB
-cleanInitDB /opt/IBM/ITM/JRE/li6263/bin/java -cp paconf.jar:/opt/IBM/ITM/classes/kjrall.jar:/opt/ibm/db2/V9.7/java/db2jcc.jar:/opt/ibm/db2/V9.7/java/db2jcc_license_cu.jar com.ibm.tivoli.pa.config.PAConfigMain -cleanInitDB
(not much help here )
-updateTables ( not operational )
On windows ( 64 bit - 6.2.3 FP1 )
On ITM 6.3.0 ( change the java search string to Java70 below )
If we are using the Oracle 12c - suggest use ojdbc7.jar
The -gui option does not work.
c:\ibm\itm\java\java60\jre\bin\java -cp c:\IBM\ITM\TMAITM6\paconf.jar;c:\IBM\ITM\TMAITM6\kjrall.jar;c:\downloads\ojdbc6.jar com.ibm.tivoli.pa.config.PAConfigMain -gui
On a windows 64 bit ITM 6.3.0 (oracle 12c ) // java is changed. oracle 6 was changed to 7.
c:\ibm\itm\java\java70\jre\bin\java -cp c:\IBM\ITM\TMAITM6\paconf.jar;c:\IBM\ITM\TMAITM6\kjrall.jar;c:\downloads\ojdbc7.jar com.ibm.tivoli.pa.config.PAConfigMain -createDB
This fails with this message.
c:\Downloads>c:\ibm\itm\java\java70\jre\bin\java -cp c:\IBM\ITM\TMAITM6\paconf.j
ar;c:\IBM\ITM\TMAITM6\kjrall.jar;c:\downloads\ojdbc7.jar com.ibm.tivoli.pa.confi
g.PAConfigMain -createDB
Mar 14, 2014 5:42:52 AM com.ibm.tivoli.pa.config.PAConfigMain process
INFO: Check if config DB already exists for PA...
Mar 14, 2014 5:42:52 AM com.ibm.tivoli.pa.config.data.DBAccessor connect
WARNING: java.sql.SQLException: Listener refused the connection with the followi
ng error:
ORA-12519, TNS:no appropriate service handler found
Mar 14, 2014 5:42:52 AM com.ibm.tivoli.pa.config.data.DBAccessor connect
WARNING: Java class path used: c:\IBM\ITM\TMAITM6\paconf.jar;c:\IBM\ITM\TMAITM6\
kjrall.jar;c:\downloads\ojdbc7.jar
Mar 14, 2014 5:42:52 AM com.ibm.tivoli.pa.config.PAConfigMain process
INFO: Done
Exporting the contents of the Performance Analyzer Configuration Data.
This is on RHEL 32 bit.
1. cd to /opt/IBM/ITM/li6263/pa/bin ( /ITM/<arch>/pa/bin folder )
2. Get the location of where the DB2 drivers are ? and also the location of the paconf.jar , cd to that folder before executing the export command.
This is a cut and paste - but you would make necessary file location changes of the DB2 and the PA Jar files.
Look at the last option - it is the export that does the activity of pulling data out and dumps to kpa_tasks.sql
/opt/IBM/ITM/JRE/li6263/bin/java -cp paconf.jar:/opt/IBM/ITM/classes/kjrall.jar:/opt/ibm/db2/V9.7/java/db2jcc.jar:/opt/ibm/db2/V9.7/java/db2jcc_license_cu.jar com.ibm.tivoli.pa.config.PAConfigMain -export
3.Troubleshooting -
- check that you are executing from the same folder where the paconf.jar is ( ls -l paconf.jar )
- check that the path to the DB2 drivers are right in the command ?
4. On successful completion
Sep 12, 2013 4:12:42 AM com.ibm.tivoli.pa.config.PAConfigMain process
INFO: Exporting tasks from DB. This may take a minute...
Sep 12, 2013 4:12:42 AM com.ibm.tivoli.pa.config.data.FileTaskStorage exportDB <==check this line - for troubleshooting .
INFO: exporting tasks from DB
Sep 12, 2013 4:12:44 AM com.ibm.tivoli.pa.config.PAConfigMain process
INFO: Export completed: Thu Sep 12 04:12:44 CDT 2013
5. Check that the file kpa_tasks.sql is having the sql commands (approx 23K lines )
6. Now do the clean up and cleanInitDB
Pre-deletion.
(Pre-deletion )
I have added a task - ( pre-deletion )
Now - delete and see that the tasks are all gone - the default tasks are cleaned out
CleanInitB Option
cleanInitDB
This will zap the ITPA tasks - there will be no tasks in the PA configurartion window.
( All the "+" will be gone )
/opt/IBM/ITM/JRE/li6263/bin/java -cp paconf.jar:/opt/IBM/ITM/classes/kjrall.jar:/opt/ibm/db2/V9.7/java/db2jcc.jar:/opt/ibm/db2/V9.7/java/db2jcc_license_cu.jar com.ibm.tivoli.pa.config.PAConfigMain -cleanInitDB
Sep 12, 2013 4:33:48 AM com.ibm.tivoli.pa.config.data.DBTaskStorage dropAllTables
INFO: Dropping all tables
Sep 12, 2013 4:33:50 AM com.ibm.tivoli.pa.config.data.DBTaskStorage dropAllTables
INFO: All tables dropped
Sep 12, 2013 4:33:50 AM com.ibm.tivoli.pa.config.data.DBTaskStorage createTables
INFO: Creating KPA Tables for the 1st time
Sep 12, 2013 4:33:51 AM com.ibm.tivoli.pa.config.data.DBTaskStorage createTables
INFO: Tables successfully created
Sep 12, 2013 4:33:51 AM com.ibm.tivoli.pa.config.PAConfigMain process
INFO: Done
This picture below says that the browser cache is still having data .
I want to see that the PA analytical tables are all empty -
IMPORTANT : Close the browser and then restart the browser again.
The below model -shows that the Browser cache was not cleaned ! so refresh cache of the browser.
execSQL kpa_tasks.sql // see results from output below
( Look below for another similar command )
/opt/IBM/ITM/JRE/li6263/bin/java -cp paconf.jar:/opt/IBM/ITM/classes/kjrall.jar:/opt/ibm/db2/V9.7/java/db2jcc.jar:/opt/ibm/db2/V9.7/java/db2jcc_license_cu.jar com.ibm.tivoli.pa.config.PAConfigMain -execSQL kpa_tasks.sql
or you can use just "/opt/IBM/ITM/lx8266/pa/config/deployed/kp0_tasks.sql'
Sep 12, 2013 4:41:49 AM com.ibm.tivoli.pa.config.data.FileTaskStorage execSQLFromFile
INFO: Executing SQL statements from: /opt/IBM/ITM/li6263/pa/bin/kpa_tasks.sql
Sep 12, 2013 4:42:00 AM com.ibm.tivoli.pa.config.PAConfigMain process
INFO: Done
Bring up the PA configuration panel and check for tasks ? that were exported.
The tasks are back.
/opt/IBM/ITM/JRE/li6263/bin/java -cp paconf.jar:/opt/IBM/ITM/classes/kjrall.jar:/opt/ibm/db2/V9.7/java/db2jcc.jar:/opt/ibm/db2/V9.7/java/db2jcc_license_cu.jar com.ibm.tivoli.pa.config.PAConfigMain -execSQL /opt/IBM/ITM/lx8266/pa/config/deployed/kp0_tasks.sql
/opt/IBM/ITM/JRE/li6263/bin/java -cp paconf.jar:/opt/IBM/ITM/classes/kjrall.jar:/opt/ibm/db2/V9.7/java/db2jcc.jar:/opt/ibm/db2/V9.7/java/db2jcc_license_cu.jar com.ibm.tivoli.pa.config.PAConfigMain -execSQL /opt/IBM/ITM/lx8266/pa/config/deployed/kpu_tasks.sql
/opt/IBM/ITM/JRE/li6263/bin/java -cp paconf.jar:/opt/IBM/ITM/classes/kjrall.jar:/opt/ibm/db2/V9.7/java/db2jcc.jar:/opt/ibm/db2/V9.7/java/db2jcc_license_cu.jar com.ibm.tivoli.pa.config.PAConfigMain -execSQL /opt/IBM/ITM/lx8266/pa/config/deployed/kp3_tasks.sql
/opt/IBM/ITM/JRE/li6263/bin/java -cp paconf.jar:/opt/IBM/ITM/classes/kjrall.jar:/opt/ibm/db2/V9.7/java/db2jcc.jar:/opt/ibm/db2/V9.7/java/db2jcc_license_cu.jar com.ibm.tivoli.pa.config.PAConfigMain -execSQL /opt/IBM/ITM/lx8266/pa/config/deployed/kp6_tasks.sql
/opt/IBM/ITM/JRE/li6263/bin/java -cp paconf.jar:/opt/IBM/ITM/classes/kjrall.jar:/opt/ibm/db2/V9.7/java/db2jcc.jar:/opt/ibm/db2/V9.7/java/db2jcc_license_cu.jar com.ibm.tivoli.pa.config.PAConfigMain -execSQL /opt/IBM/ITM/lx8266/pa/config/deployed/kpi_tasks.sql
/opt/IBM/ITM/JRE/li6263/bin/java -cp paconf.jar:/opt/IBM/ITM/classes/kjrall.jar:/opt/ibm/db2/V9.7/java/db2jcc.jar:/opt/ibm/db2/V9.7/java/db2jcc_license_cu.jar com.ibm.tivoli.pa.config.PAConfigMain -execSQL /opt/IBM/ITM/lx8266/pa/config/deployed/kp4_tasks.sql
destroyDB -
To be used - when we are typically uninstalling the PA component. - It iwll drop all TEPS DB related to ITPA.
How to recreate the ITPA tables back ?
Stop all processes. ( hd,sy , pa, cq, TEMS )
Run the paconf.jar command with the destroyDB option.
Stop Database db2stop
Start Database db2start.
Re-install the ITPA and configure the TEPS. ( itmcmd config -A cq ) Use the MTEMS instead.
This should bring back the original ITPA tasks.
Other flags supported by the tool are :
createDB - will create the databases - but with no content ( there is a small bug that needs to be fixed )
updateTables ( no args at the end ) - needs to be investigated.
Other options for the same command are :
java -jar paconf.jar [-export {taskfile} [-domain domainCode] |-createDB|-destroyDB|-cleanInitDB|-gui|-bareExecSQL|-execSQL taskfile-updateTables]
-export Export tasks to a file. Default to: kpa_tasks.sql. Optional -domain parameter specifies which domain tasks shoud be exported. Use 000 to export tasks not assigned to any domain.
-createDB Create the PA DB if it is not there
-destroyDB Drop all tables in TEPS DB created by ITPA
-cleanInitDB Re-create the PA DB. Same as -destroyDB then -createDB
-gui Bring up the bare bone GUI (not fully functional
-bareExecSQL Executing SQL statements from specified file. Tasks active/inactive state will not be preserved.
-execSQL Executing SQL statements from specified file. Tasks active/inactive state will be preserved.
-updateTables Update tables to the latest version (create nonexisting ones)
I will describe the other options in my later blog.
Wednesday, September 11, 2013
Sample DB2 commands.
A sample statement to dump all the data from a particular table to an external file
export to outfile.txt of del select * from itmuser."Linux_CPU_Averages_H"
--
Likewise one can import it back into the tables
import from outfile.txt of del insert into itmuser."Linux_CPU_Averages_H"
--
Getting a count of records in a table.
select count(*) from itmuser."Linux_CPU_Averages_H"
export to outfile.txt of del select * from itmuser."Linux_CPU_Averages_H"
--
Likewise one can import it back into the tables
import from outfile.txt of del insert into itmuser."Linux_CPU_Averages_H"
--
Getting a count of records in a table.
select count(*) from itmuser."Linux_CPU_Averages_H"
Friday, September 6, 2013
KFWITM217E - cannot load product configuration data.
This can happen if the Historical collections panel is open on the TEP GUI and the database is shut down in the back end ( accidentally )
To resolve - check if the DB2 is running and then restart it. Close the Historical collection and reopen it.
When you move the control over one of the attribute groups in the historical collection Configuration window - and the database ( in this case DB2 ) got shutdown.
To resolve - check if the DB2 is running and then restart it. Close the Historical collection and reopen it.
When you move the control over one of the attribute groups in the historical collection Configuration window - and the database ( in this case DB2 ) got shutdown.
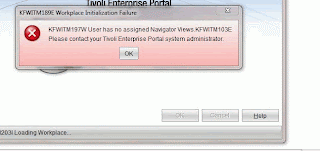
KFWITM197E - User has no assigned navigator views.
This popup on TEP GUI can show up when user tries to login and has earlier messed up the sysadmin privileges ( like changing administrator modes and author modes etc etc )
To resolve this.
1. Rebuild the TEPS.
2. Restart the TEPS.
If this does not work... try this
1. Stop TEPS
2. drop database TEPS
3. db2stop ( force if required )
4. db2start
list active databases - to check that only WAREHOUS is there.
5. Reconfigure TEPS
6. Start TEPS
( just to start afresh -I stopped TEMS, HD, SY, WPA and SPA as well )
This did it.
Tuesday, September 3, 2013
kpacma.log missing in 6.2.3.FP1
This is the log file for the Performance Analyzer. Gets created in the <ITMHOME>/logs folder - Gives a run of the agent.
Check if the Performance Analyzer is configured and it is successful. Go to MTEMS and start the agent.
Note the missing values for configuring the PA in the User Interface - this is the cause of the missing kpacma.log file.
cd ITMHOME/logs
ls -l kpacma.log - is missing.
Now,configure it
Restart the agent after the configuration, and the kpacma..log will be created
Monday, September 2, 2013
Unable to launch TEP Portal Client ( Launching the Client in VNC works but does not work on Windows platform. )
Sometimes if you get this message. as shown below.
"Unable to open the application"
Identify where you got this problem. In my case the problem was on my laptop, but If I launch the VNC - the TEP JWS was able to launch !
So the change has to be on the windows laptop - drivers/etc/hosts file.
Changes made were
1: Clear the Java cache
2. Update the /etc/hosts drivers file as shown.
9.118.41.57 nc9118041057.in.ibm.com nc9118041057
"Found unsigned entry in resource."
Subscribe to:
Posts (Atom)